 8b7d03cbf0
* Add metrics-generator component

* Add some initial logic to make the generator module optional

* Rename tempo_distributor_metrics_generator_clients metric

* Periodical check in: add remote-write setup

* jsonnet: rename generator -> metrics_generator

* Periodical check in: add instance, copy servicegraphprocessor over, add scrape endpoint

* Fix make test

* Support spanmetrics via OTel collector

Generator is now able to run an embedded OTel collector.
This allows to run any number of processors, which includes spanmetrics.

This collector uses a custom metrics exporter and a remote write client.
Metrics generated by the spanmetrics processor are converted to Prometheus
and appended to the remote write client's WAL, which will export the metric
data after commit.

* Implement internal spanmetrics processor

* Add latency metrics

* Only loop one for latency metrics

* Improve how metrics are collected, some bug fixes

Changes:
- Remote write was constantly failing with “out of order samples”. Fix: apparently the timestamp has to be in milliseconds, not in seconds. There is not a lot of documentation on the Prometheus interfaces, but the cortex proto has a field timestampMs.
- After this remote write was failing with label name \"le\" is not unique: invalid sample. Fix: there was a bug in the append logic of the labels array. Since you were reusing the labels variable in a for-loop, the le label was added multiple times.

Initially I thought pushing metrics on every push request was causing the out-of-order issues, so I refactored the processor a bit to have both a PushSpans and a CollectMetrics method. CollectMetrics is called every 15s with a storage.Appender. This way we can also use a single appender for multiple processors,
This wasn’t necessary to get it working, but I think this is the logic we want to end up with (i.e. don’t send samples too often to keep DPM low).

* make vendor-check

* Add spanmetrics_test.go

* jsonnet: add metrics-generator service

* Add distributor.enable_metrics_generator_ring; some bug fixes

* Remove unused Registerer and scrape endpoint code; sprinkle some more TODO's around

* Add crude mechanism to trim active series in span metrics processor

* span metrics: add delete_after_last_update

* Admit config parameters in spanmetrics processor

Histogram buckets and additional dimensions can be configured

* Initial implementation of service graphs processor

* Hook up service graph processor

Store
- make sure tests pass
- fix copy-paste error in shouldEvictHead

Service graphs
- ensure metric names align with agent
- server latencies were overwriting client latencies
- expose operational metrics

* Rename metrics from generator_processor_... to metrics_generator_processor_...

* Set up BasicLifecycler, load balance spans across metrics-generator

* Replace processor.CollectMetrics with a custom prometheus.Registerer

Changes:

Service graphs processor
- replaced code to manually build metrics with CounterVec and HistogramVec
- aligned metric names with the agent
- commented out code around collectCh, this was leaking memory

Span metrics processor
- replaced code to manually build metrics with CounterVec and HistogramVec

Introduced Registry to bridge prometheus.Registerer and storage.Appender

Add support for configuring external labels

Fix generator_test.go

* make vendor-check

* Refactor remote-write structures, add tests

* Add add_instance_id_label config

* Split write requests up to a max msg size

Builds write requests up to a max size and sends them sequentially.

* Service graphs: collect edges when completed

When an edge is completed, it's sent to be collected by a number of
goroutines that call collectEdge.

Edges can also be collected when expired.

* Store: interface: give paramaters names

* Service graphs: Close closech

* Simplify evict method name

* Move remote_write to its own method

* Add metrics_generator_processors to overrides, dynamically create/remove processors

* Add tests for split requests in remote write appender

* Refactor distributor code a bit

* Make collection interval configurable

* Add concurrency test for instance

* Minor tweaks

* Add metrics to track failed active processors updates

* Tweak remote write metrics

* Add exemplars support

* Fix latency measurement in spanmetrics processor

* Fix typo

* Change metrics generator enabled config var

* Return ready when generator is registered in the ring

* Add read-only mode during generator shutdown

* Configure docker-compose distributed to work with metrics generator

* Enable pushing bytes to metrics-generator

* Remove cortex from distributed example

* Replace cortexpb -> prompb, move all remote-write stuff into remotewrite package

* Set context timeout when collecting metrics, remove hola

* Protect readOnly from concurrency

* Update vendor

* Rename metrics prefix span_metrics to spanmetrics

This matches the naming from OTel spanmetrics processor

* Always add le="+Inf" bucket when not set already

* Fix lint errors

* Fix compactor test

Test was writing tempodb.Trace to the WAL, instead of tempodb.TraceBytes

* Move expire goroutine to collector workers

* Move metrics_generator_enabled to the top-level config

* Update docker-compose distributor example

* Use snappy from klauspost/compress

* Fix distributor test after moving metrics_generator_enabled flag

* Reorganize how processors are updated, simplify use of locks

* Stub time in processor tests

* Fix how label slices are handled in registry

* jsonnet: disable metrics-generator by default

* Regenerate kube manifests

* Pin time.Now in test with registry

* Update CHANGELOG.md

Co-authored-by: Koenraad Verheyden <[email protected]>
Go tracing and monitoring (Prometheus) for net.Conn


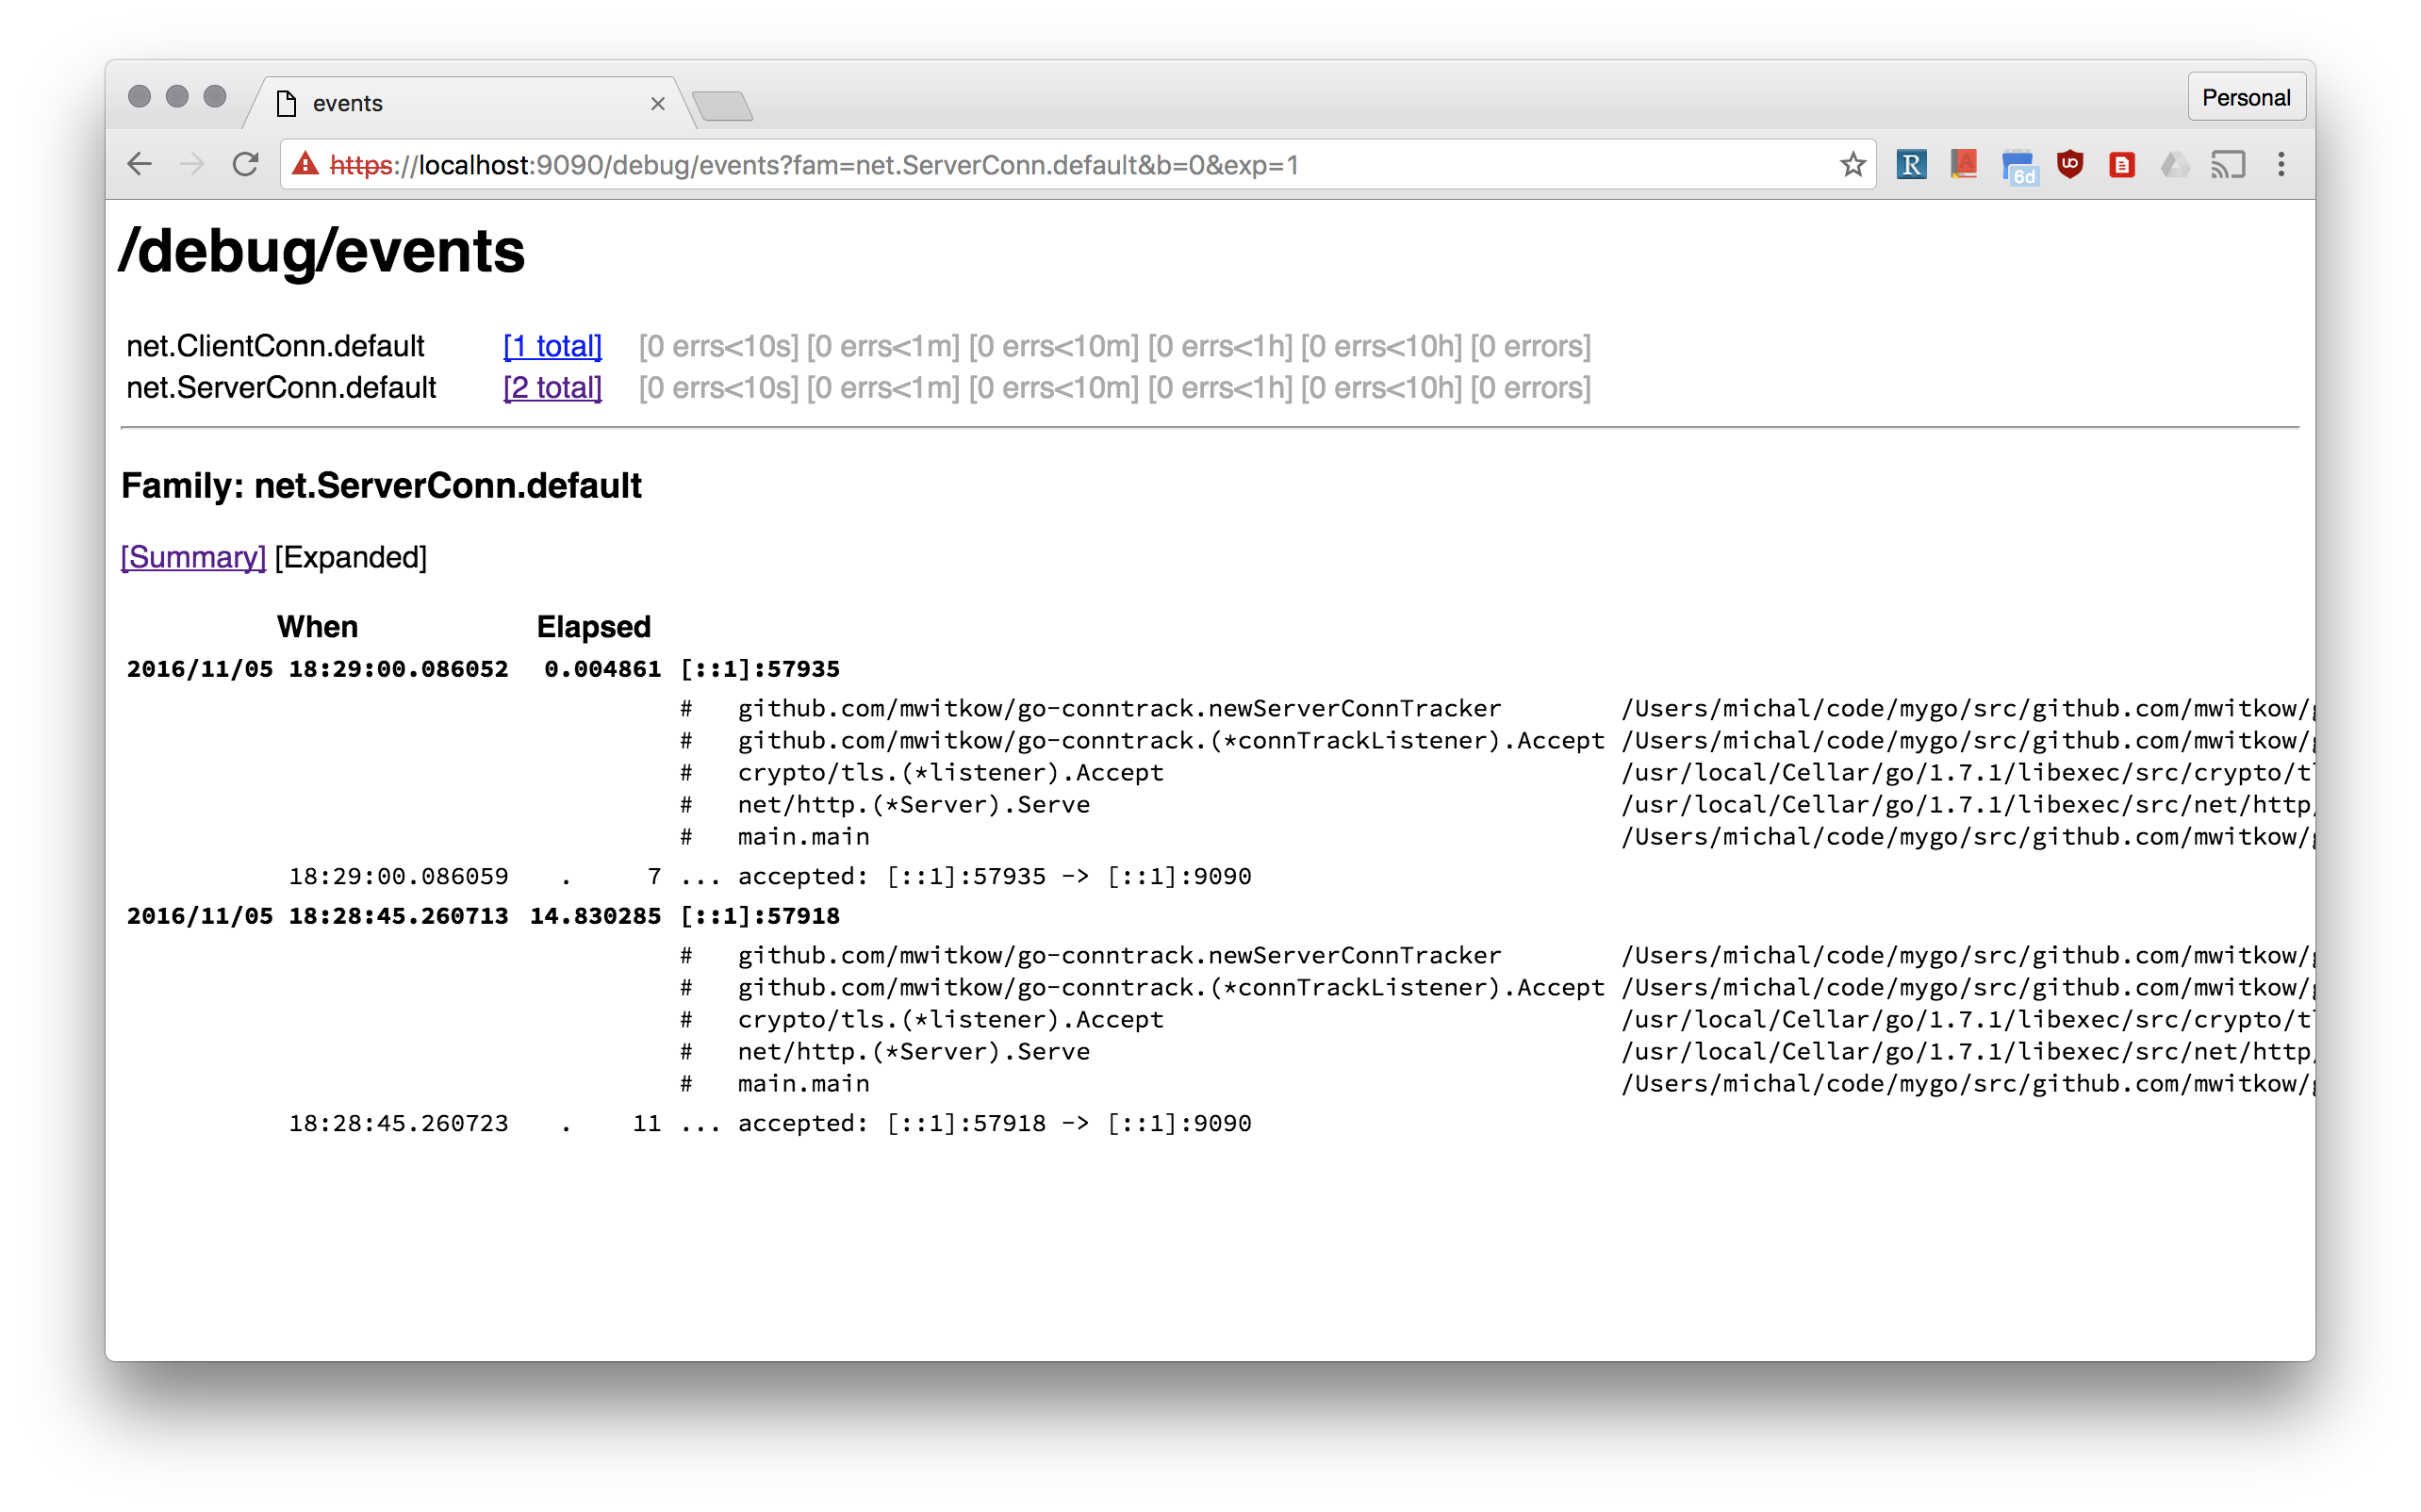
Prometheus monitoring and x/net/trace tracing wrappers net.Conn, both inbound (net.Listener) and outbound (net.Dialer).
Why?
Go standard library does a great job of doing "the right" things with your connections: http.Transport pools outbound ones, and http.Server sets good Keep Alive defaults.
However, it is still easy to get it wrong, see the excellent The complete guide to Go net/http timeouts.
That's why you should be able to monitor (using Prometheus) how many connections your Go frontend servers have inbound, and how big are the connection pools to your backends. You should also be able to inspect your connection without ssh and netstat.
How to use?
All of these examples can be found in example/server.go:
Conntrack Dialer for HTTP DefaultClient
Most often people use the default http.DefaultClient that uses http.DefaultTransport. The easiest way to make sure all your outbound connections monitored and trace is:
http.DefaultTransport.(*http.Transport).DialContext = conntrack.NewDialContextFunc(
    conntrack.DialWithTracing(),
    conntrack.DialWithDialer(&net.Dialer{
        Timeout:   30 * time.Second,
        KeepAlive: 30 * time.Second,
    }),
)
Dialer Name
Tracked outbound connections are organised by dialer name (with default being default). The dialer name is used for monitoring (dialer_name label) and tracing (net.ClientConn.<dialer_name> family).
You can pass conntrack.WithDialerName() to NewDialContextFunc to set the name for the dialer. Moreover, you can set the dialer name per invocation of the dialer, by passing it in the Context. For example using the ctxhttp lib:
callCtx := conntrack.DialNameToContext(parentCtx, "google")
ctxhttp.Get(callCtx, http.DefaultClient, "https://www.google.com")
Conntrack Listener for HTTP Server
Tracked inbound connections are organised by listener name (with default being default). The listener name is used for monitoring (listener_name label) and tracing (net.ServerConn.<listener_name> family). For example, a simple http.Server can be instrumented like this:
listener, err := net.Listen("tcp", fmt.Sprintf(":%d", *port))
listener = conntrack.NewListener(listener,
    conntrack.TrackWithName("http"),
    conntrack.TrackWithTracing(),
    conntrack.TrackWithTcpKeepAlive(5 * time.Minutes))
httpServer.Serve(listener)
Note, the TrackWithTcpKeepAlive. The default http.ListenAndServe adds a tcp keep alive wrapper to inbound TCP connections. conntrack.NewListener allows you to do that without another layer of wrapping.
TLS server example
The standard lobrary http.ListenAndServerTLS does a lot to bootstrap TLS connections, including supporting HTTP2 negotiation. Unfortunately, that is hard to do if you want to provide your own net.Listener. That's why this repo comes with connhelpers package, which takes care of configuring tls.Config for that use case. Here's an example of use:
listener, err := net.Listen("tcp", fmt.Sprintf(":%d", *port))
listener = conntrack.NewListener(listener,
    conntrack.TrackWithName("https"),
    conntrack.TrackWithTracing(),
    conntrack.TrackWithTcpKeepAlive(5 * time.Minutes))
tlsConfig, err := connhelpers.TlsConfigForServerCerts(*tlsCertFilePath, *tlsKeyFilePath)
tlsConfig, err = connhelpers.TlsConfigWithHttp2Enabled(tlsConfig)
tlsListener := tls.NewListener(listener, tlsConfig)
httpServer.Serve(listener)
Status
This code is used by Improbable's HTTP frontending and proxying stack for debuging and monitoring of established user connections.
Additional tooling will be added if needed, and contributions are welcome.
#License
go-conntrack is released under the Apache 2.0 license. See the LICENSE file for details.